Temperature-Humidity graph.jpg
Alex and the Redfoot

Temperature-Humidity graph.jpg

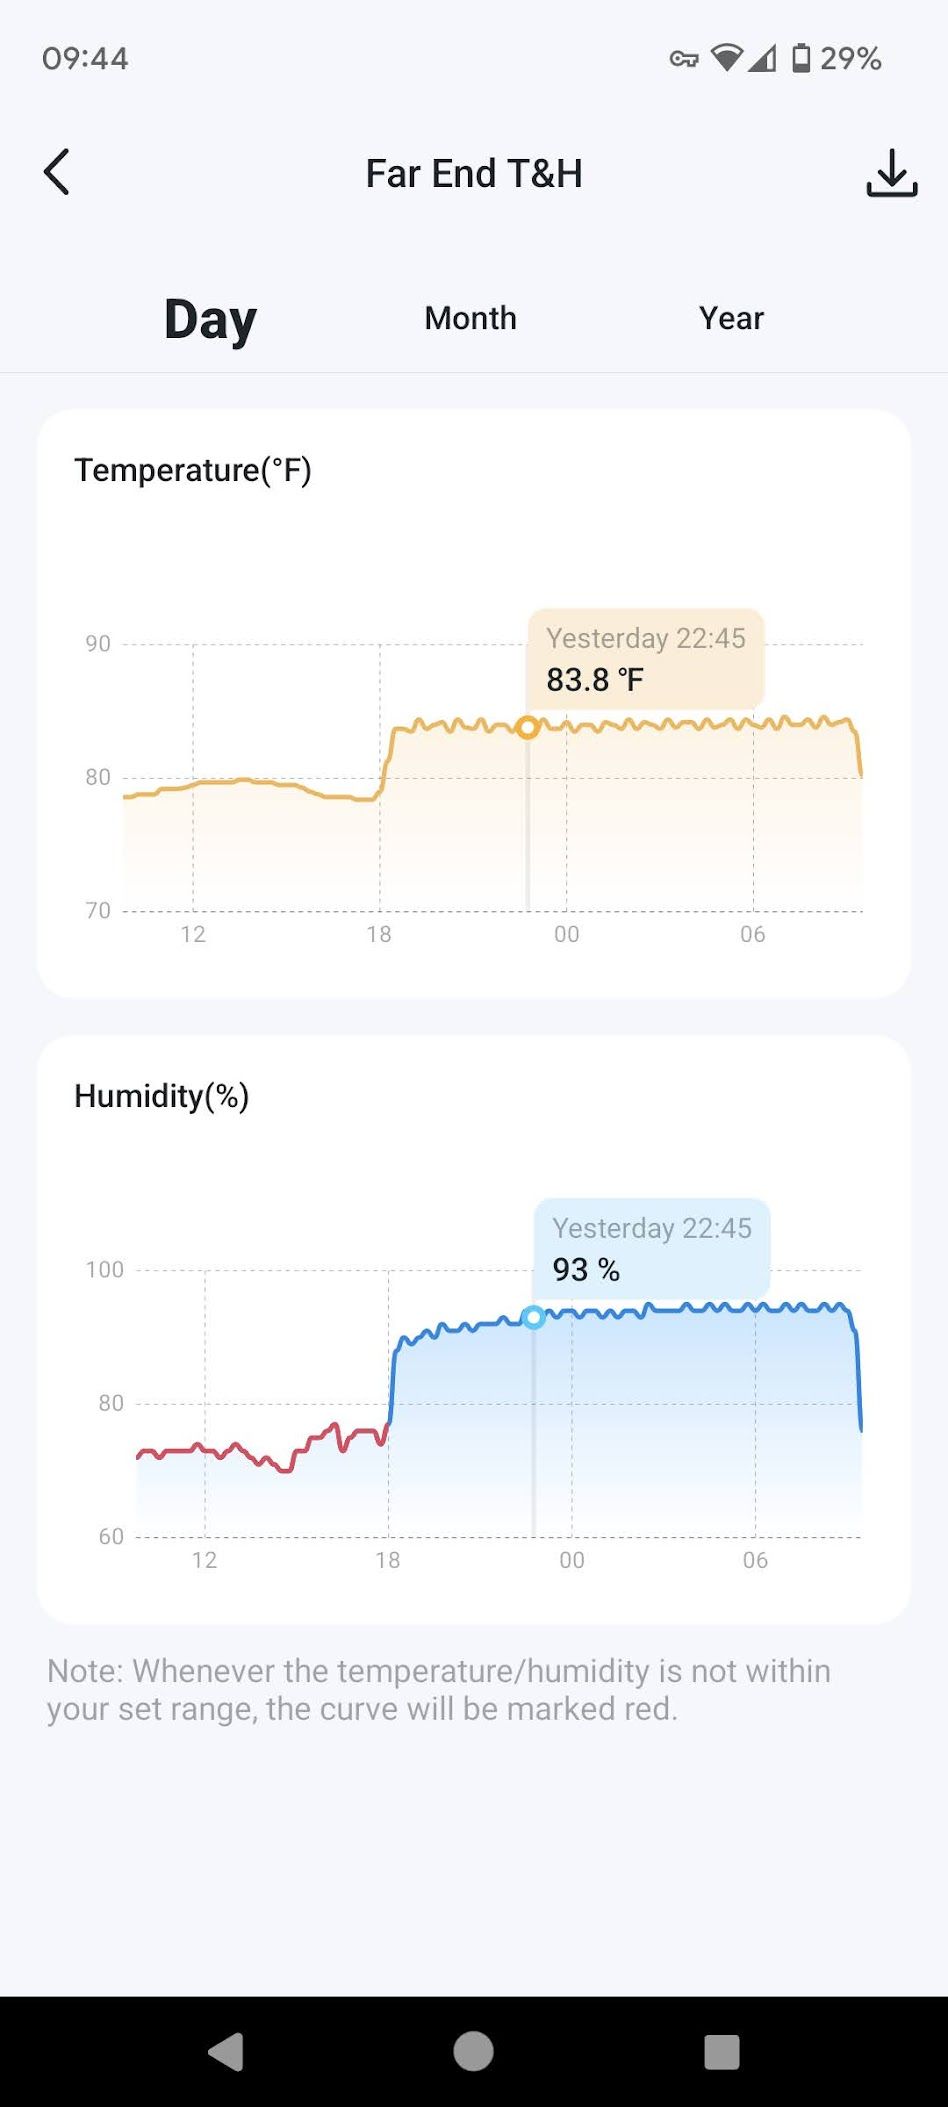
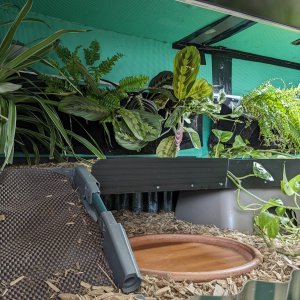
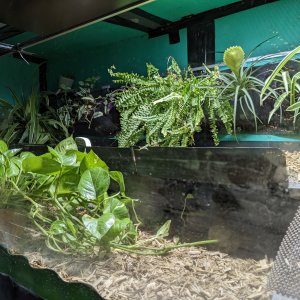
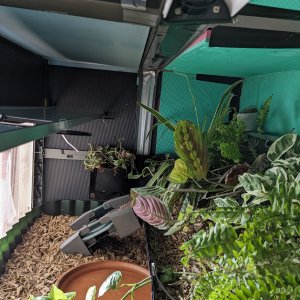
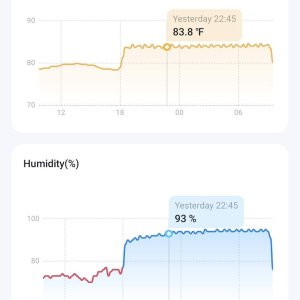
That's temp and humidity statistics from indoor enclosure. Low values on the left are daytime, when enclosure is opened, lights/RHPs are off and Besha's is walking outside on her balcony, the right part of the graph - is the night time, when RHPs are on and lids are closed.
  • Like
Reactions: ecachuh
There are no comments to display.

Media information

Album
Besha's Enclosures
Added by
Alex and the Redfoot
Date added
View count
327
Comment count
0
Rating
0.00 star(s) 0 ratings

Image metadata

Filename
Screenshot_20231008-094442.jpg
File size
112.2 KB
Dimensions
948px x 2107px

Share this media

Top